II Trends in Healthcare and Medical Care in Hiroshima after the War
1 Characteristics of Hiroshima City Seen from the Causes of Death
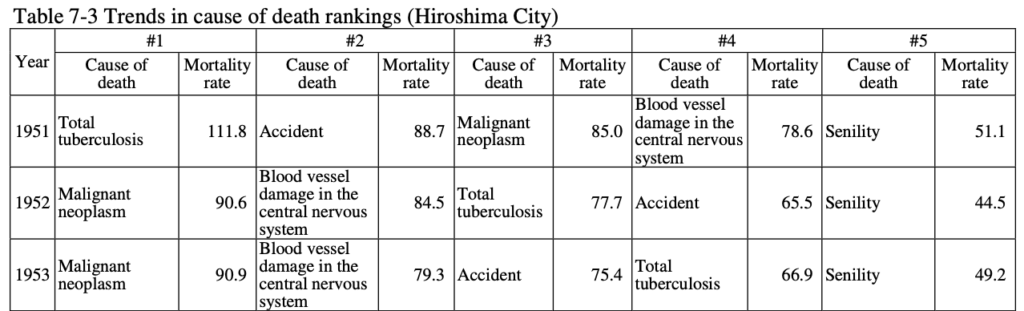
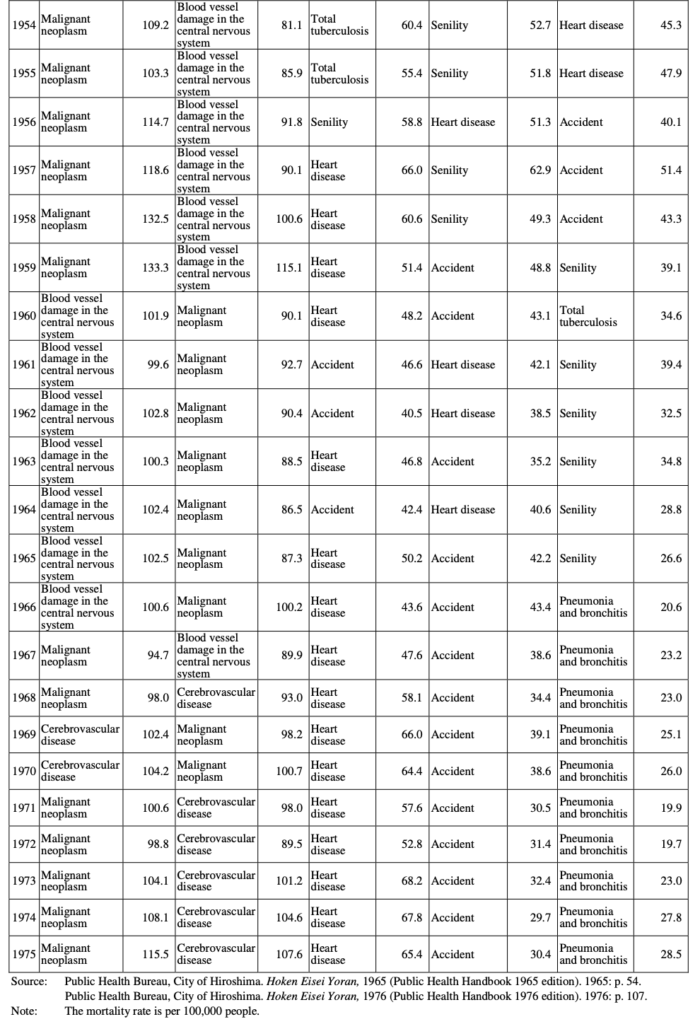
According to the trends in rankings for causes of death in Hiroshima City between 1951 and 1975 as shown in Table 7-3, in 1951 the number one cause of death was tuberculosis (in all forms), as it had been in preceding years. However, from 1952 the number one cause of death was malignant neoplasm, and from 1960 vascular injury to the central nervous system. The other causes among the top five include accidents, heart disease and senility.
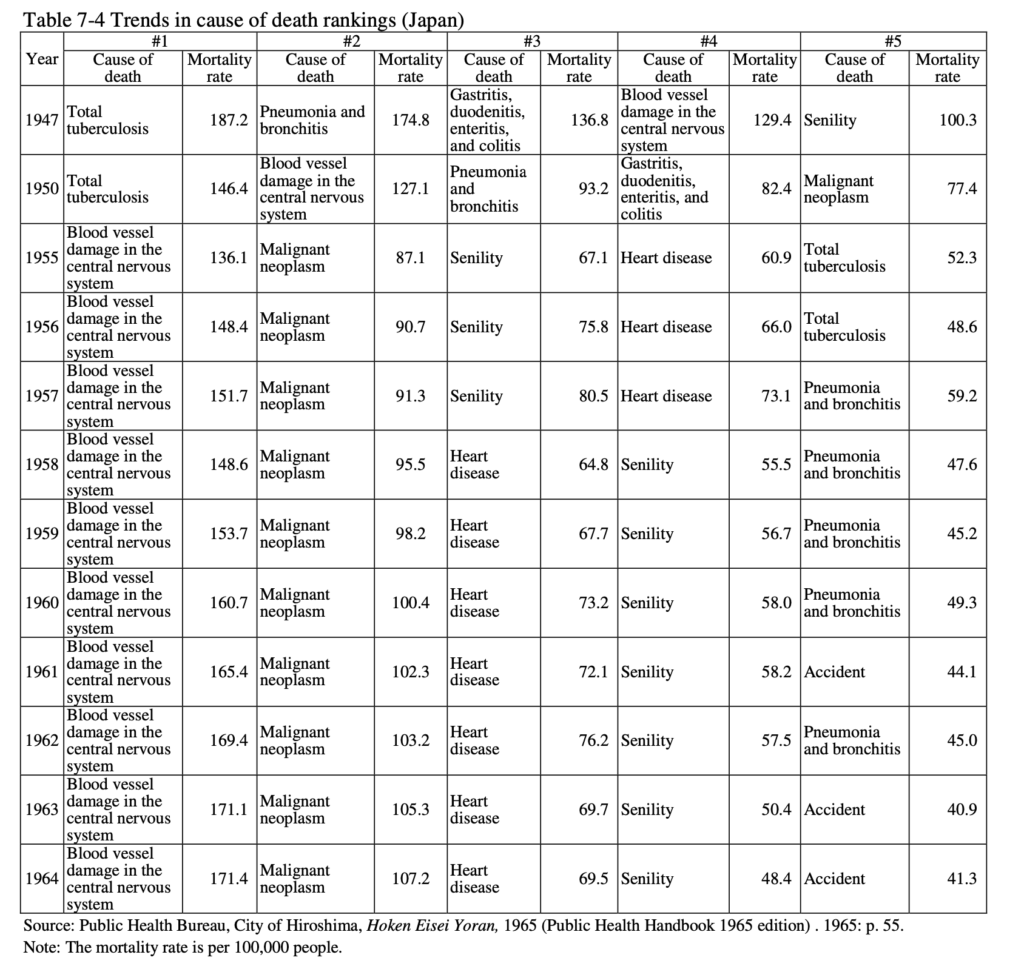
When compared to the national average in Table 7-4, what stands out in Hiroshima City is that the number of patients who died of the top five causes per 100,000 people was fewer, however deaths from malignant neoplasms and accidents ranked high. For malignant neoplasms especially, which reached the second leading cause nationwide for the first time in 1955, it was the number one cause from 1952 to 1959 in Hiroshima City, with a consistent rise in the mortality rate. Furthermore, it should be noted that the mortality rate of the malignant neoplasm in Hiroshima City was much higher than that of the whole country. For example, in 1955, while it was 87 nationwide, it was 103 in Hiroshima.
Looking at the demographic statistics in Hiroshima City compared to those of Japan, the low birthrate and high stillbirth rate were conspicuous. The mortality rate, infant mortality rate, and newborn mortality rate were all lower than the national average.25)
2 Trends in Medical Institutions
In categorizing medical institutions by management style, in late 1940s and early 1950s in Hiroshima Prefecture, the number of hospitals increased 20% (91 to 106) and that of clinics 10% (1,406 to 1,535) from 1948 to 1953; and the number of hospital beds increased 50% from 1950 to 1953 (4,501 to 6,718).26) Meanwhile, the number of hospitals in Hiroshima City increased 20% (43 to 51) from 1951 to 1955, the number of general clinics 30% (232 to 307), the number of dental clinics 10% (from 151 to 164), and the number of hospital beds 40% (from 2,176 to 3,135).27) Looking at this, we see that the growth rate in the number of clinics in Hiroshima City was bigger than that of the entire Hiroshima Prefecture.
Next, with regard to the medical institutions in Hiroshima Prefecture from 1956 to 1975, the number of hospitals increased 50% (168 to 246), general clinics 40% (1,397 to 2,011), dental clinics 20% (671 to 781), namely, all increased. When divided by decades, the number of hospitals increased 40% from 1956 to 1965 and leveled out from 1966 to 1975; the number of general clinics increased 30% during the first decade and 10% during the latter; and the number of dental clinics increased 10% in both decades.28)
While Hiroshima Prefecture showed these changes in its medical institutions,
Hiroshima City showed a 50% increase in hospitals from 1956 to 1975 (55 to 82), a 120% increase in general clinics (336 to 741), and an 80% increase in dental clinics (164 to 296). When looking at decadal trends, the number of hospitals increased 30% from 1956 to 1965 and 10% from 1966 and 1975; general clinics increased 40% and 50%, and dental clinics increased 20% and 40%, respectively.29) When compared with Hiroshima Prefecture overall, there were no differences found in the growth rate hospitals, but Hiroshima City had higher growth rate in general clinics and dental clinics.
With regard to the number of beds in Hiroshima Prefecture (using the same material as
the number of medical institutions), the number of beds in hospitals increased 110% from 1956 to 1975 (13,278 to 27,655) and 180% in general clinics (2,366 to 6,656). Both medical institutions showed a marked increase, but the increase was higher in clinics. When looking at trends by decade, the increase in number of beds at hospitals was 60% from 1956 to 1965 and 20% from 1966 to 1975. While the increase in the number of beds was higher in the first decade for hospitals, for general clinics the increase was 60% and 80% respectively, showing it was higher in the second decade.
Using the same methods when looking at the number of beds in medical institutions in Hiroshima City, we see a 180% increase, from 3,337 to 9,202 beds, over 20 years. They increased 80% from 1956 to 1965, and 30% from 1967 to 1975. Looking at this, the growth rate of added beds is significantly higher in Hiroshima City than in Hiroshima Prefecture, which shows that the hospitals in Hiroshima City were getting bigger. As explained above, the growth rate in the number of clinics in Hiroshima City exceeded that of hospitals. Therefore, it is probable that the growth rate of beds in clinics also exceeded that of the hospital in the city and that of all medical institutions in the prefecture as well. However, we were actually unable to get any material that could confirm this.
Finally, with regard to the number of healthcare professionals in Hiroshima City, during the 25 years from 1951 to 1975, the number of physicians increased 230% (495 to 1,626), dentists 190% (173 to 498), and pharmacists 210% (277 to 861). This indicates that the increase rate of healthcare professionals is somewhat higher than that of beds, which shows efforts were made to increase the quality of medical care.30)
Notes
25. Public Health Bureau, City of Hiroshima. Hoken Eisei Yoran, 1976 Nen Ban (Public Health Handbook 1976 Edition), p. 89.
26. Department of Health, Hiroshima Prefecture. Hiroshimaken Eisei Tokei (Statistics on Public Health of Hiroshima Prefecture). Edition of 1948 through 1953.
27. Extension Division, Hiroshima City Public Health Center (Ed.). Eisei Tokei (Statistics Report on Public Health). Edition of 1951 through 1955.
28. Department of Health, Hiroshima Prefecture. Hiroshimaken Eisei Tokei Nenpo: Dai Juhachi Go (1965), Dai Nijuroku Go (1973), Dai Nijuhachi Go (1975) (Annual Report of Statistics on Public Health in Hiroshima Prefecture Year 1965: No. 18, Year 1973: No. 26, and Year 1975: No. 28).
29. The Hiroshima City Higashi Public Health Center and the Hiroshima City Nishi Public Health Center. Eisei Nenpo,1963 Nen Ban (Annual Report on Public Health, 1963 Edition).Public Health Bureau, City of Hiroshima. Hoken Eisei Yoran: 1976 Nen Ban (Public Health Handbook, 1976 Edition).
30. Public Health Bureau, City of Hiroshima. Hoken Eisei Yoran: 1965 Nen Ban, 1976 Nen Ban (Public Health Handbook, 1965 and 1976 Editions).